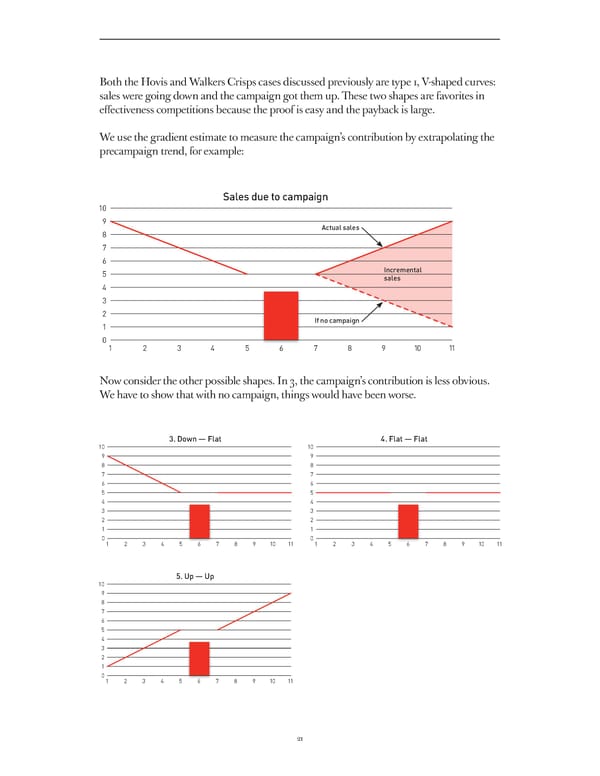
Both the Hovis and Walkers Crisps cases discussed previously are ty pe 1, V-shaped curv es: sales were going down and the campaign got them up. Th ese two shapes are favorites in eff ectiveness competitions because the proof is easy and the payback is large. We use the gradient estimate to measure the campaign’s contribution by extrapolating the precampaign trend, for example: Sales due to campaign 10 9 Actual sales 8 7 6 5 Incremental sales 4 3 2 1 If no campaign 0 1 2 3 4 5 6 7 8 9 10 11 Now consider the other possible shapes. In 3, the campaign’s contribution is less obvious. We have to show that with no campaign, things would have been worse. 3. Down — Flat 4. Flat — Flat 10 10 9 9 8 8 7 7 6 6 5 5 4 4 3 3 2 2 1 1 0 0 1 2 3 4 5 6 7 8 9 10 11 1 2 3 4 5 6 7 8 9 10 11 5. Up — Up 10 9 8 7 6 5 4 3 2 1 0 1 2 3 4 5 6 7 8 9 10 11 21
 A Guide To Effectiveness Page 20 Page 22