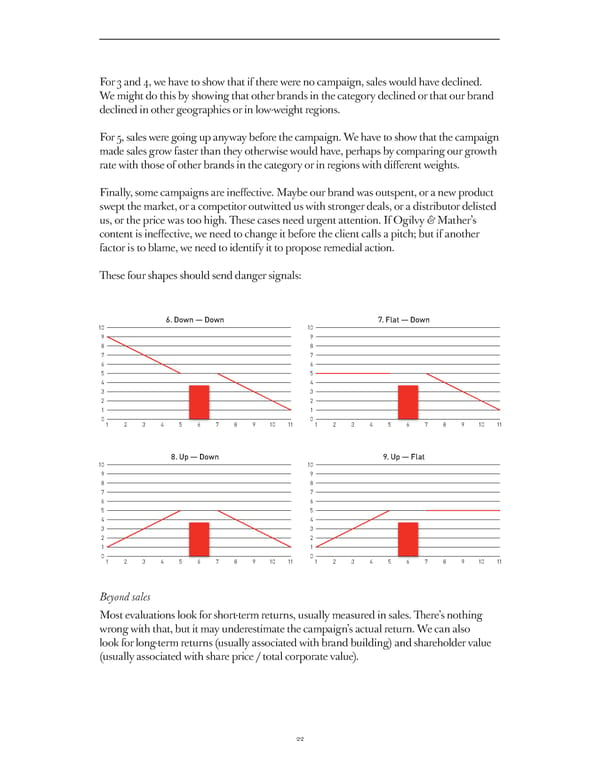
For 3 and 4, we have to show that if there were no campaign, sales would have declined. We might do this by showing that other brands in the category declined or that our brand declined in other geographies or in low-weight regions. For 5, sales were going up anyway before the campaign. We have to show that the campaign made sales grow faster than they otherwise would have, perhaps by comparing our growth rate with those of other brands in the category or in regions with diff erent weights. Finally, some campaigns are ineff ective. Maybe our brand was outspent, or a new product swept the market, or a competitor outwitted us with stronger deals, or a distributor delisted us, or the price was too high. Th ese cases need urgent attention. If Ogilvy & Mather’s content is ineff ective, we need to change it before the client calls a pitch; but if another factor is to blame, we need to identify it to propose remedial action. Th ese four shapes should send danger signals: 6. Down — Down 7. Flat — Down 10 10 9 9 8 8 7 7 6 6 5 5 4 4 3 3 2 2 1 1 0 0 1 2 3 4 5 6 7 8 9 10 11 1 2 3 4 5 6 7 8 9 10 11 8. Up — Down 9. Up — Flat 10 10 9 9 8 8 7 7 6 6 5 5 4 4 3 3 2 2 1 1 0 0 1 2 3 4 5 6 7 8 9 10 11 1 2 3 4 5 6 7 8 9 10 11 Beyond sales Most evaluations look for short-term returns, usually measured in sales. Th ere’s nothing wrong with that, but it may underestimate the campaign’s actual return. We can also look for long-term returns (usually associated with brand building) and shareholder value (usually associated with share price / total corporate value). 22
 A Guide To Effectiveness Page 21 Page 23