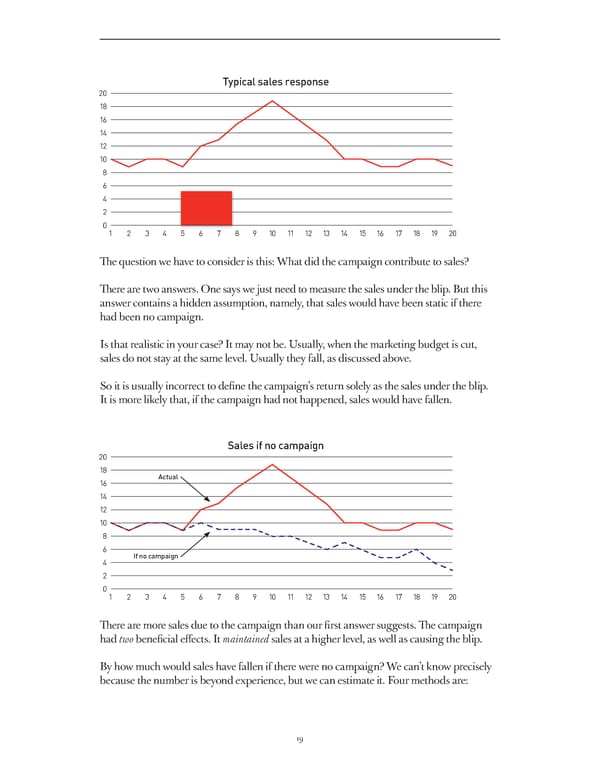
Typical sales response 20 18 16 14 12 10 8 6 4 2 0 1 2 3 4 5 6 7 8 9 10 11 12 13 14 15 16 17 18 19 20 Th e question we have to consider is this: Wh at did the campaign contribute to sales? Th ere are two answers. One says we just need to measure the sales under the blip. But this answer contains a hidden assumption, namely, that sales would have been static if there had been no campaign. Is that realistic in your case? It may not be. Usually, when the marketing budget is cut, sales do not stay at the same level. Usually they fall, as discussed above. So it is usually incorrect to defi ne the campaign’s return solely as the sales under the blip. It is more likely that, if the campaign had not happened, sales would have fallen. Sales if no campaign 20 18 16 Actual 14 12 10 8 6 4 If no campaign 2 0 1 2 3 4 5 6 7 8 9 10 11 12 13 14 15 16 17 18 19 20 Th ere are more sales due to the campaign than our fi rst answer suggests. Th e campaign had two benefi cial eff ects. It maintained sales at a higher level, as well as causing the blip. By how much would sales have fallen if there were no campaign? We can’t know precisely because the number is beyond experience, but we can estimate it. Four methods are: 19
 A Guide To Effectiveness Page 18 Page 20